
Our Outlook: A Challenging Period Ahead for Entrepreneurs
We’re seeing a record shortage of venture capital right now. That shortage relative to demand will not affect every entrepreneur equally: while some businesses might be able to turn burn down and continue to innovate, such as those with meaningful revenue, other more capital intensive industries (deeptech, fintech) are in a comparatively more challenging environment. As we wrote previously, this is a moment for “Slow Money” investors to support their portfolio and be there when times are tough, because the ample and fickle “Fast Money” that has flooded the market the past few years will not be there to help.
Analogously, this means the most skilled founders are in the strongest position, because execution will dominate over access to capital, a reversal of the prior years. Many entrepreneurs have pulled levers to extend their runway, and at Tribe Capital we have worked tirelessly with our portfolio to navigate the present environment. Those of us at Tribe are prepared to utilize our full infrastructure to support the next phase of potential N-of-1 outcomes.
When demand greatly exceeds supply, suppliers profit: those with capital who are aggressive will be in a generational position to demand great terms on their investments. In the coming months, the aggregate demand for capital will be dire, and we believe that will be the right time to be aggressive.
Today the Demand for Venture Capital Greatly Exceeds the Supply
Most participants in Venture markets today, be them LPs, Venture Capitalists or Entrepreneurs, are aware that capital availability has dropped in the past 12 months. It is no secret that total investment at multiple different levels of venture capital has regressed to 2020 levels. At the same time, the demand for capital is driven by the size and quantity of venture-backed companies in operation, which has exploded during the great growth during 2021.
We all feel this discrepancy, and at Tribe we have quantified the role of supply and demand of capital in venture investing. Our measurement was so dramatic that it prompted us to share more broadly.
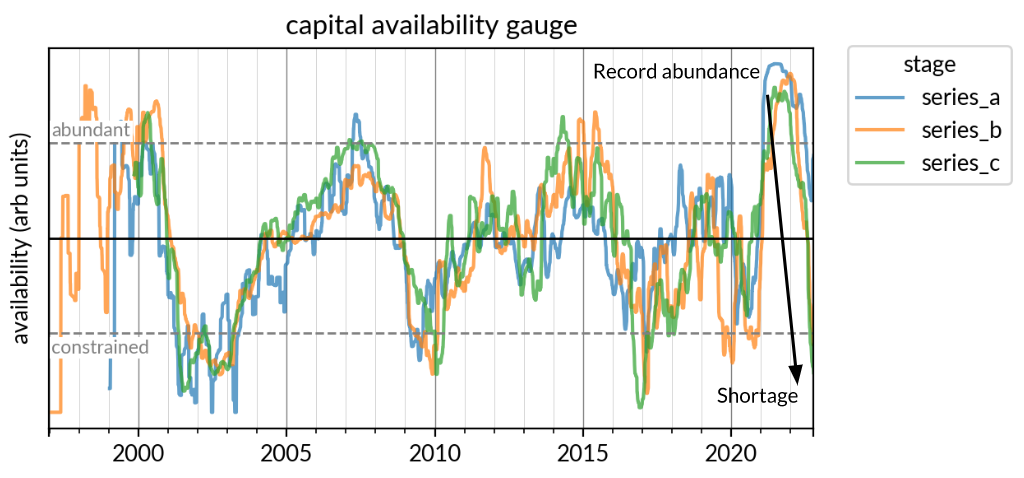
Our capital availability gauge (visualized below) measures [how much investment actually happened] relative to [how much capital would have been raised if companies seeking capital did so in normal times]. In this sense, it measures the supply (actual investment) relative to demand (potential investment) of capital in early stage investing.
Our findings are that we are moving from a period of a record abundance of capital to one of a significant shortage.
One might reasonably expect this type of swing: indeed if more money was raised and more companies exist, then it is not surprising to see a shortage. The challenge to this argument is that venture capital has seen rapid, sustained total investment growth for more than a decade, and absent more context we could make this argument during nearly any period over that timeframe.
This dynamic is reflected in our measurement: even during 2016-2020, a period where by many measures venture investment grew by a factor of 2-4x, our gauge is flat: during this period, investment in the early stage is adequately balanced by later stage investment.
Let us look deeper at Series B, as an example, by decomposing the core components of the model: the actual amount raised along with the potential investment. Here, the potential investment is the amount that would be invested if every company seeking a Series B investment raised capital (for more detail see the appendix).
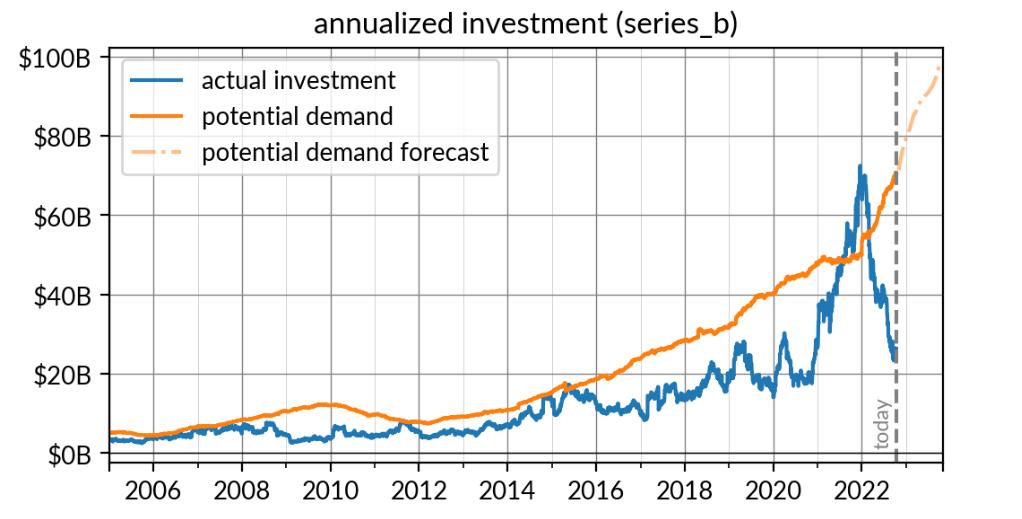
The learning from the above measurement is that, there is demand for roughly $70B of capital (annualized) of investment at the Series B, but $25B of capital is being invested at an annualized rate, or roughly 1/3 of what is demanded. The $45B deficiency is the largest ever observed, and we expect conditions to worsen. Since our demand projections over the next year depend only on investment before today, we continue our projection to estimate the total demand for Series B investment to reach $100B by late 2023, where demand will continue to rise into the present bear market due to prolific Series A fundraising in the end of 2021 and the beginning of 2022. The story for other venture stages is analogous.
We acknowledge that record Venture Capital dry powder is also widely reported, such as by PitchBook. Indeed a lot of present dry powder was raised during a period of capital abundance and the reported figures often lag the current state of affairs. If future fundraising for venture is less abundant, which we and many in the industry expect in the short term, pacing will be stretched out and therefore is consistent with the short term gap in supply and demand. We believe in accordance with this, when dry powder is put into action it will cover some, but not all, of the capital deficiency. But the question of how much typical venture fund pacing slows over the next 12-24 months will be an important factor in how much tightness is felt in early stage fundraising.
We’re a venture capital firm focused on recognizing and amplifying early stage product-market fit. Reach us at hello@tribecap.co.
Appendix
Constructing the Capital Availability Gauge
In order to answer the question of capital availability we measure two primary inputs. For the sake of illustration let us consider the Series B gauge.
- Actual investment: how much actual Series B investment did we observe?
- Potential investment: If the typical cohort of Series A companies raised typical amounts of Series B funding at the typical time, how much investment would we observe?
Note there are two nuances to handle: exits, and companies that go out of business.
Exits, which we define as acquisitions meaningfully beyond liquidation preference or an IPO, tend to affect a small portion of the companies in question (1-4%), and therefore do not materially affect the measurement. Further, the effect exits have on our measurement is correlated to fundraising, further diminishing the impact of exits on the measurement of capital availability.
The approach to incorporating companies that go out of business is to construct the potential investment component to include every company that would be in-market, and if companies are unable to raise capital at all then it will be reflected in lower actual investment, and hence the gauge organically includes this case. A repercussion of this is potential investment tends to exceed actual, but this is by design for the reasons above.
Measuring (1) Actual investment is relatively straightforward: measure total Series B investment, and apply typical time series analysis, such as smoothing.
Measuring (2) Potential investment requires more care. As mentioned above, we capture total demand holistically by considering all companies who raised a Series A.
- Look at all companies who raised a Series A
- Size up what their Series B would be by looking at how much larger a typical Series B is relative to a Series A – this component of the measurement is organic and we capture temporal changes in our model
- The potential Series B demand is (b) applied at 2 years after the Series A
There is more care put into these measurements, such as how to smooth each component, but the essence is outlined above. Our final gauge, which conducts a normalization based on present balance of supply and demand relative to what is typical, is positive when typical actual investment exceeds typical potential investment, and negative when to the contrary.
Legal Notices
This document is strictly confidential and is intended for authorized recipients only. It includes confidential, proprietary, and trade secret information of Tribe Capital Management, LLC and is presented for discussion purposes only. Any unauthorized copying, disclosure, or distribution of the material in this article is strictly forbidden without the express written consent of Tribe Capital Management LLC (“Tribe Capital”).
This document is for informational purposes only and is not intended as investment advice, an offer, or solicitation with respect to the purchase or sale of any security.
Certain information presented herein has been supplied by third parties, including management or agents of the underlying portfolio company. While Tribe believes such information to be accurate, it has relied upon such third parties to provide accurate information and has not independently verified such information.
This document contains forward-looking statements. The opinions, forecasts, projections, or other statements, other than statements of historical fact, are forward-looking statements. Forward-looking statements can be identified by the use of words such as “anticipate,” “intend,” “believe,” “estimate,” “plan,” “seek,” “project,” “expect,” “may,” “will,” “would,” “could” or “should,” the negative of these terms or other comparable terminology. Examples of forward-looking statements include statements relating to macroeconomic conditions, expectations regarding future growth, including future revenue and earnings increases, margins, free cash flow projections, and annual growth rates; growth plans and opportunities, including our strategies for future or potential acquisitions, product expansion, targets, and geographic expansion; estimated returns on in future; and assumptions underlying these expectations. Actual events or results or the actual performance may differ materially from those reflected or contemplated in such statements. Such assumptions may require modification as additional information becomes available. Nothing contained in this presentation may be relied upon as a guarantee, promise, assurance, or a representation as to the future. These statements have not been reviewed by anyone outside of Tribe Capital and while Tribe Capital believes these statements are reasonable, they do involve a number of assumptions, risks, and uncertainties.
The graphs, charts, and other visual aids are provided for informational purposes only. None of these graphs, charts, or visual aids can of themselves be used to make investment decisions. No representation is made that these will assist any person in making investment decisions and no graph, chart or other visual aid can capture all factors and variables required in making such decisions.
TRIBE CAPITAL®, N-of-1™, and certain other marks or logos displayed on this presentation are trademarks owned by Tribe Capital. You may not use any of those or any other Tribe Capital trademarks or trade names in any manner that creates the impression that such names and marks belong to or are associated with you or your affiliates or are used with Tribe Capital’s consent.