
We’ve developed a Tech Adoption Gauge to quantify adoption within specific industries.
- Historical adoption of technology is known to follow an S-curve whereby low adoption gives rise to an era of rapid adoption followed by ubiquity.
- We have developed a quantitative metric, dubbed the “Tech Adoption Gauge”, to quantify this adoption curve.
- Our metric suggests that Sustainability/Energy tech and AI are near inflection points.
- Focusing on early-stage investing, AI funding hasn’t increased much by historical standards. This suggests that early-stage investors may be waiting for market validation, which would indicate the end of one S-curve and the beginning of another.
- By contrast, early-stage Sustainability funding is gaining momentum, suggesting that it is closer to its inflection point. Other early-stage industries to watch are Space, Crypto, and Healthtech.
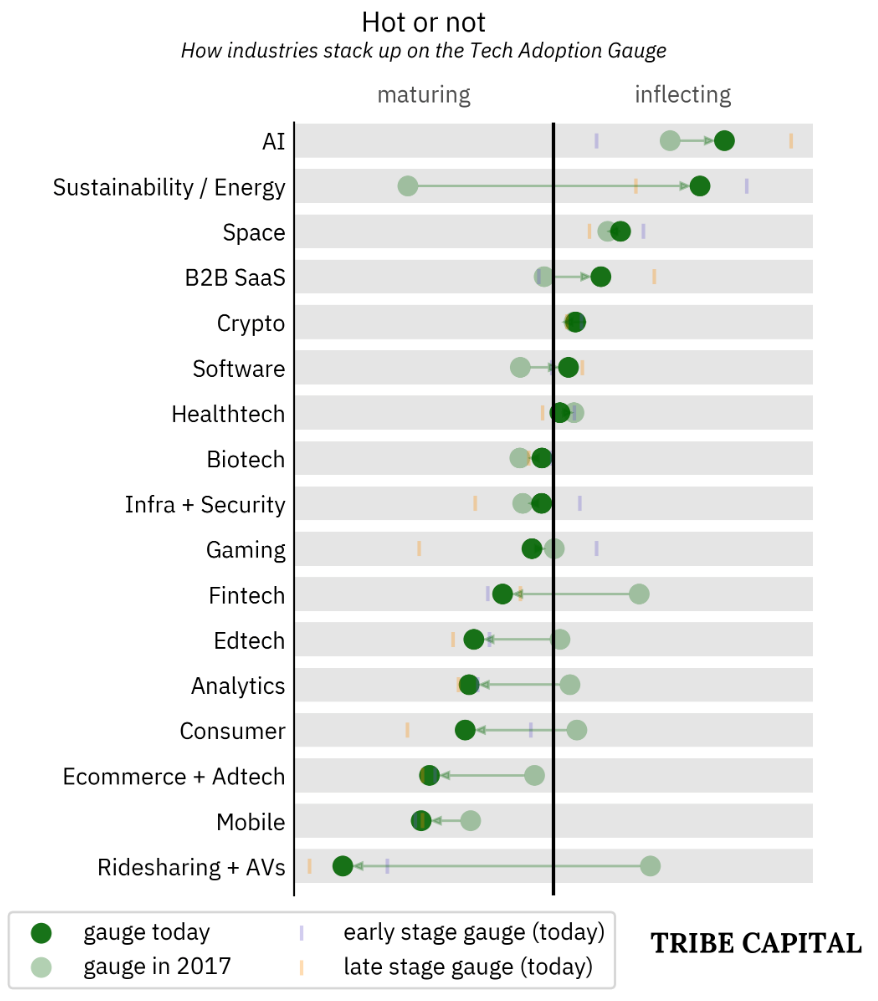
AI and Sustainability rank best, while Ecommerce, Mobile, and Ridesharing rank worst.
Source: Crunchbase and Tribe internal analysis.
Introducing a quantitative measure of technology S-curves.
Amidst a record VC funding desert, many investors ask when the markets will turn around. We believe that this is the wrong question. They should ask: where is the most meaningful innovation happening right now? By studying what proportion of VC investment goes to different industries over time, we find that markets are hottest in AI and Sustainability/Energy. These industries together accounted for nearly a third of late-stage funding and a fifth of early-stage funding in the last year, outpacing stalwart venture sectors like fintech and health-tech.
Builders don’t stop just because the market is down. Those investing in the hottest social and tech trends may hardly notice the cyclical drag. We believe that market participants need to pivot to some degree in response to emerging trends and technologies.
AI – Industry of renewal, driven by tech curves.
We have found that there is often a difference between what investors say and what they invest in. For instance, AI has consumed only around 9% of early-stage venture dollars so far in 2023–nearly identical to the 8% of venture dollars committed to early-stage AI in 2018. This surprises us; these days, it seems early-stage investors often can’t finish two sentences without mentioning ChatGPT. Accounting for a 2-3 month reporting lag, Microsoft’s $10bn January investment in OpenAI appears to be just about the only unusual activity in AI so far this year.
This doesn’t necessarily mean AI is all hype and no bite. In order to explain what’s happening, we need to zoom out and think in terms of long-term tech curves, which we explore in depth in the FAQ. We believe the current lack of early-stage capital in AI masks the crucial insight that all AI are not created equal. We were already well into a decade-long AI tech curve when LLMs burst onto the scene, obviating some older models and sparking the public’s imagination. Older generations of language-adjacent machine learning are at risk of becoming obsolete to new companies that leverage foundation models such as GPT. At the same time, early AI companies leveraging GPT have unknown business models and levels of competitive differentiation; hence making some investors wary of deploying capital. Our research shows that we are at the end of one s-curve and the start of another.
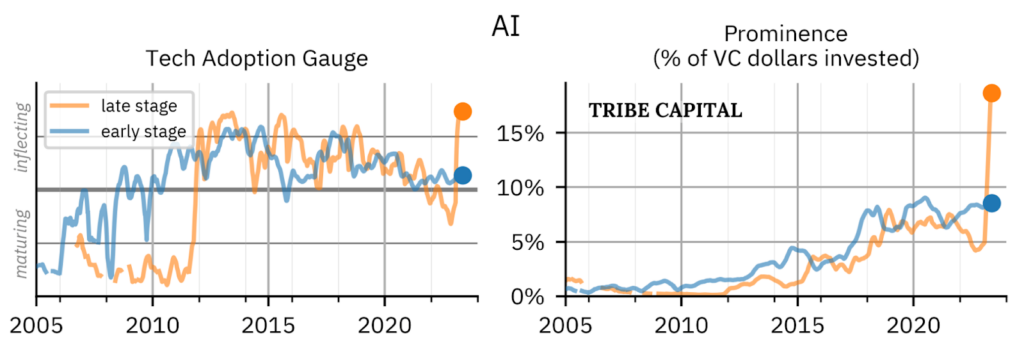
Figure (left): The Tech Adoption Gauge for AI throughout the past 20 years.
Figure (right): The proportion of venture dollars that have gone into AI, over time. Late-stage AI funding is at an all-time momentum high, but early stage funding is not.
Source: Crunchbase and Tribe Capital internal analysis.
Indeed, many AI companies are suffering. Autonomous vehicles, for instance, are currently seeing their lowest investing prominence since 2017 (1.5%). The broader AI tech curve contains the AI companies of yesteryear, which were squarely positioned as B2B SaaS products. The unexpected brilliance of transformer LLMs has shortened the curve of some previous generations of natural language processing. In addition, this category has seen a very steep decline from cyclical forces, whereas these high-beta SaaS companies have suffered from a slowdown among business buyers and the market’s disapproval of cash-intensive sales teams. Some existing AI companies may successfully jump to the next curve and potentially be successful, but we don’t yet know what will separate the wheat from the chaff.
In AI, we believe that many are probably falling into the trap of “overestimating the change in the next two years, and underestimating the change in the next ten.” There is hype around AI for good reason, but the total amount of economic utility in this particular wave is still unknown. Nevertheless, the long-term pattern of investing shows that, whether this wave or the next, AI could create massive value. In our opinion, long-term-minded entrepreneurs should stick it out through cyclical and secular forces to reap the gains on innovation in AI.
Sustainability – Hotter than hot, driven by non-tech secular forces.
Following the green failures of the late aughts, clean energy seemed to be a longtime VC bugaboo–until now. Sustainability and clean energy technologies are on a tear, claiming nearly 10% of VC dollars in 2023, up from 1-2% just five years ago. Series B funding for energy companies reached all-time high in 2023, briefly exceeding $10B annualized. This illustrates how some of the most important forces in tech investing aren’t tech at all–they’re sociopolitical.
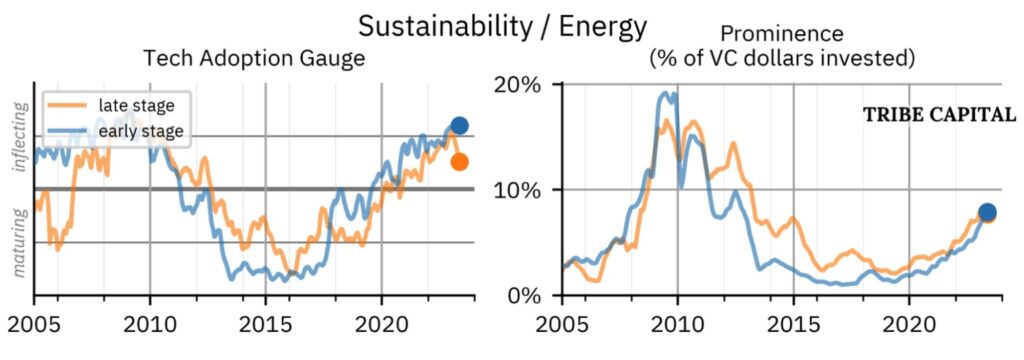
Figure: Tech Adoption Gauge and Prominence for Energy. Energy investing has had two distinct peaks: one around 2009, and another which appears to be now/soon. Prominence has still not reached the levels of 2009.
Source: Crunchbase and Tribe Capital internal analysis.
In contrast to AI, which is a solution in search of problems, climate change is a problem in search of solutions. The social and scientific factors driving attention to climate change are hard to measure, but the rubber hits the road with government action. This is typified by the Inflation Reduction Act (or IRA), in which $370bn of spending is earmarked for energy. (Add to this a large web of local and state tax breaks.) Although direct support of innovative companies isn’t politically feasible after bungles like Solyndra, broad funding sources such as the IRA find their way into startups’ revenue streams.
The geographic differences between clean energy investments are striking. Europe, which received over half its VC money for clean energy for many years (see table below), is still averaging over 20% of VC dollars going towards sustainability. Europe has done so well recently in the geographic cut of the Tech Adoption Gauge (see Figure 4, right), and the indexing effect of investing heavily in an increasingly-popular technology is one reason why. It appears to be backing off, however.
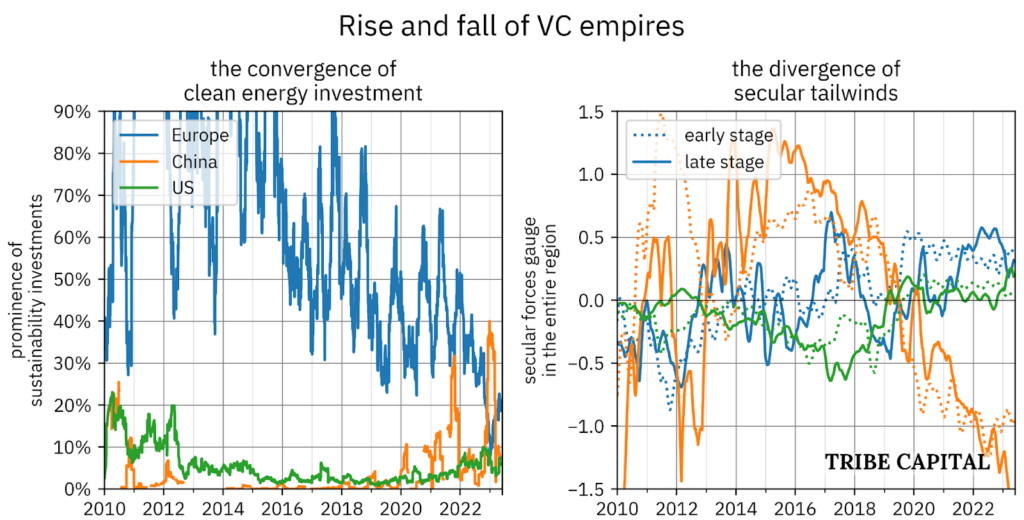
Figure 4 (left): The prominence of clean energy investing in three separate geographies. For instance, in 2017, between 40-80% of venture capital that was received by European startups went to clean energy.
Figure 4 (right): The Tech Adoption Gauge applied to these same three geographies. China (orange) has faced a steep falloff, while Europe (blue) has gained momentum.
Source: Crunchbase and Tribe Capital internal analysis.
China, for its part, has contributed some of the largest clean energy raises over the last couple of years. This includes companies such as ~$2.5bn Series A for GAC Aion (electric vehicles), an ~$650m Series B for SFCC (hydrogen vehicles), and ~$650m round for SPIC (solar). But there is some reason to believe that these forms of investments won’t continue. All of these rounds had significant involvement from state-owned investors such as the National Green Development Fund, and policy indicates that sustainability is waning as a CCP goal. In China’s 13th five-year plan (released 2016), sustainability was a major theme, but by contrast, the 14th five-year plan focuses much more heavily on digital tech.
Speaking more broadly, China’s overall prominence in VC funding has fallen significantly (see Fig 4 right). China went from being one of the hottest geographic VC markets in the mid-2010s to one of the coldest by 2023. This cooling began before the 2019 CCP crackdown on tech, but those actions certainly did not help Chinese VC from sliding into a minor ice age.
Ecommerce – Maturing and highly exposed to cyclical forces.
Attention and capital are scarce resources, and these growing categories have stolen momentum from many other sectors. One casualty is e-commerce and ad-tech, which once together consumed 30% of VC investments, but now accounts for only 10-13%. This category includes e-commerce enablement, such as cookie tracking, consumer intelligence, and dropshipping. In developed markets, the technology is built and the industry is in a late period of sustaining innovation; accordingly, the secular forces gauge is in “maturing” status. (See FAQ #1 for an explanation.) This leaves ecommerce enablers exposed to cyclical forces, leading to very low capital availability and adverse effects on valuation. This could all change with breakthroughs in AR/VR, or drone shipping, but for now we are fairly early on those curves.
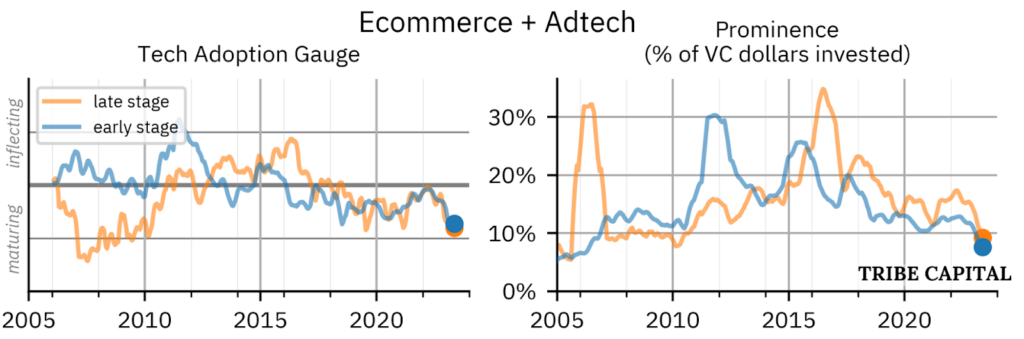
Figure: Ecommerce & Adtech gauge and prominence. This tech has gone through most of its current s-curve.
Source: Crunchbase and Tribe Capital internal analysis.
Conclusion – Getting ahead of the curve
The current downturn has been challenging for founders and companies. But there is good news: even the most powerful cyclical forces can be overcome by secular and technological forces. For companies in maturing sectors, the business cycle will be difficult to weather. Finding ways to attach to newer tech curves will help, such as finding ways to adopt AI into products and workflows. Furthermore, many of today’s hot industries, such as sustainability and AI, are part of longer-term tech curves that are only now having their moment. Those that can sense the convexity of social and technological movements well before they develop will be best positioned to catch the next wave.
We expect some of the biggest successes to come out of sectors that are very early on the curve. VC is a business of outliers, and aggregate measures often fail to predict extraordinary success driven by the force of sheer will and a little luck. The Tech Adoption Gauge indicates the market consensus on today’s most exciting technologies, but it’s important to look around the corner, too. There are always entrepreneurs that buck the trends, and breakout teams in every geography, stage, and industry.
We’re a venture capital firm focused on recognizing and amplifying early stage product-market fit. Reach us at hello@tribecap.co.
FAQ
What are technology s-curves, and is that how things really work?
Technology s-curves represent the development of new, more productive ways of doing things. They are characterized by phases of introduction, growth, and maturity. We observe that capital supply is proportional to the steepness of the technology curve. This means that capital supply is lowest at the start and end of the curve, and highest in the middle:
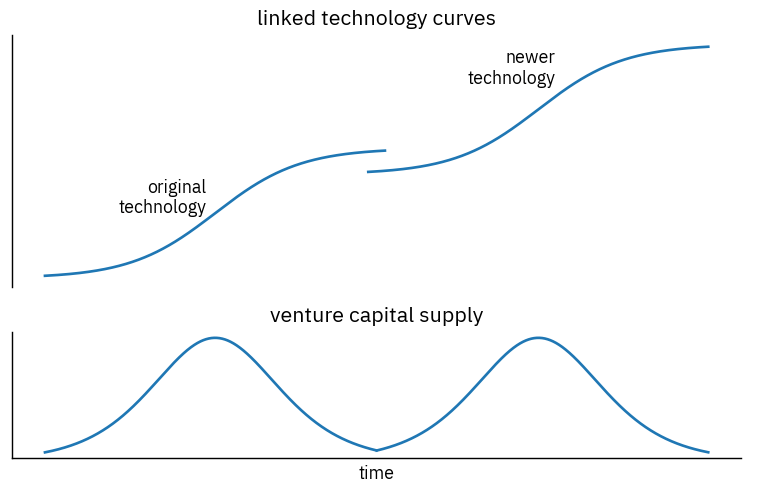
Figure: Theoretical technology S-curve (top) and VC supply in response (bottom).
Source: Crunchbase and Tribe Capital internal analysis.
Here’s the intuition. At the emergence of a new technology, market participants may not be sure of its risk/reward characteristics or where to invest smartly, so they are hesitant to deploy capital. This is what we believe is happening currently in generative AI; concerns about defensibility, questions about business models, and uncertainties about the true power of the technology are causing most investors to hold back (despite tweeting loudly). If the technology continues to compound to an inflection point, capital crowds into the growing industry. At maturity, innovation capital exits as growth tails off.
We see this pattern clearly in tech markets of the past 30 years. Take mobile, by which we mean businesses that were built primarily as mobile apps, or to support mobile use cases for example. The underlying technology curve is smartphones, app store marketplaces, and phone payments; this tech is nearing maturity. In order to correct for cyclical effects, we use as our indicator the proportion of venture dollars spent on mobile, which we call “funding prominence”. The inflection point, as measured by US smartphone adoption, was around 2012-2014, which coincides with the highest funding prominence of mobile, around 20%.
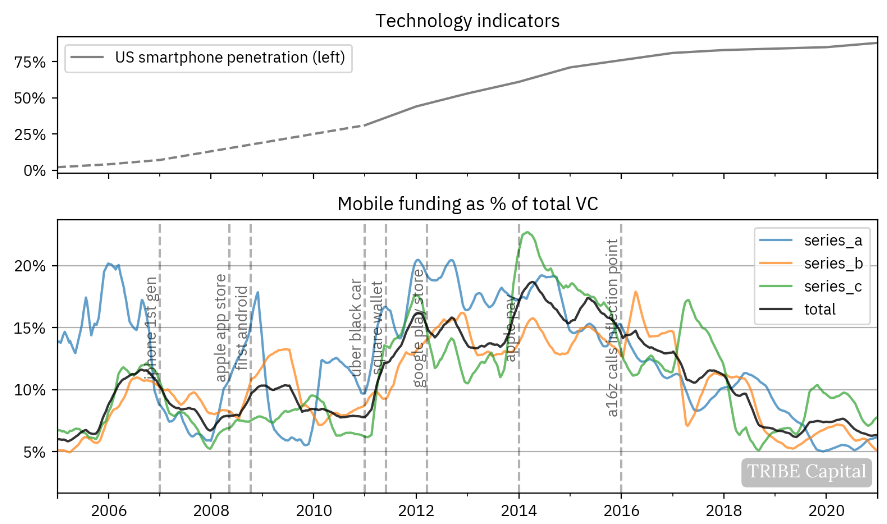
Figure (top): US Smartphone penetration as a standalone indicator of technology development,
which displays a distinct s-curve.
Figure (bottom): Prominence of mobile funding over time, demonstrating the expected VC response to the tech curve.
Source: Crunchbase and Tribe Capital internal analysis.
The impact of tech curves on capital availability depends on where the market thinks we are on the technology curve, how steep it is, and how much further there is to go. In order to estimate the market’s approximation of where we are on the curve, we compare today’s prominence to past prominence to get the following gauge:
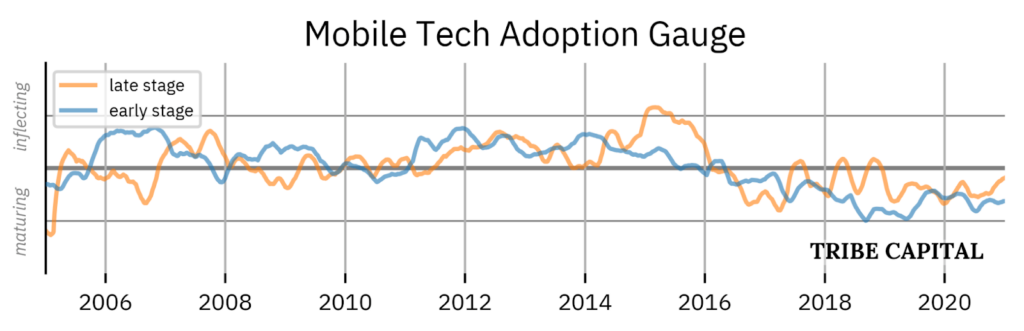
Figure: The Tech Adoption Gauge for Mobile, which reached inflection status when the technology was inflecting. This metric does not introduce foreknowledge.
Source: Crunchbase and Tribe Capital internal analysis.
The gauge compares the recent prominence in venture funding to past prominence. A gauge near or above 1 indicates an industry that is expected to be in very high convex stages of growth, whereas a gauge below -1 indicates a maturing industry. The gauge for mobile shows that the market correctly believed it to be near inflection territory in 2012-2014, but it then cooled to maturity by 2018.
Here’s one more example of a maturing technology: ridesharing/hailing. The giants Uber, Didi, Lyft, and the like, emerged in the 2010s on the back of mobile, matching algorithms, and urban geospatial data. There are still new ridesharing companies, but we are clearly on the mature side of this technology curve. The secular forces gauge correctly captures this below.
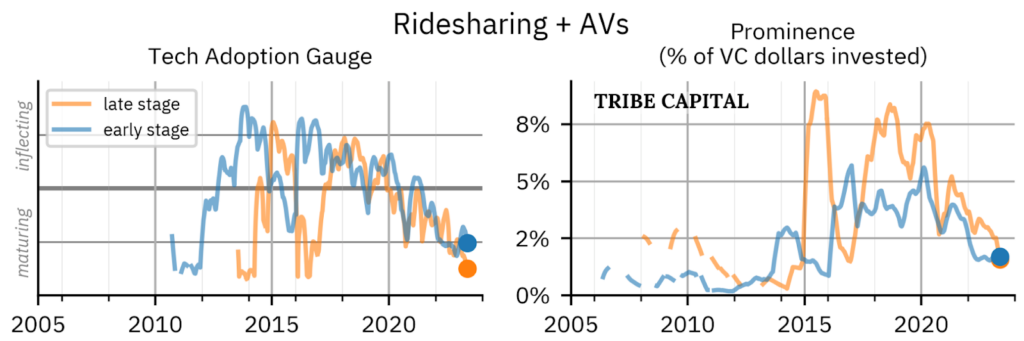
Figure: Tech Adoption Gauge and Prominence of ridesharing, showing a very distinct rise, inflection, and maturity.
Source: Crunchbase and Tribe Capital internal analysis.
Linked S-curves
No technology emerges from a vacuum; everything has a precursor. Although our measures only go back to around the year 2000, most of the tech we see inherited progress from a previous technology. In the lingo of S-curves, these curves connect, and the new technology picks up where the previous one left off. We believe that VC has the same reaction pattern:
Figure: Theoretical “linked” s-curves. In this case, the VC response repeats itself for the second curve.
For illustrative purposes only.
We see this clearly in the sustainability sector, whereas a major push was made in 2011 and now again in the early 2020s:
Figure: Tech Adoption Gauge for Sustainability, showing two distinct periods of inflection.
Source: Crunchbase and Tribe Capital internal analysis.
What are cyclical forces vs. secular forces?
Cyclical forces, which we measure in Crossing the Desert, are tied to the business cycle of booms and busts. This cycle is well-described in any macroeconomic theory; because markets are uncoordinated and contain feedback loops, they tend to overbuild/over-invest in the good times, which leads to the need for drawbacks. These cycles run on 10-15 year time loops. Cyclical forces tend to hit the public markets before private markets, since price adjustment is very quick.
Secular forces, which we measure in this article, operate on uncoordinated and (typically) longer timescales. Neither technological breakthroughs nor socio-political issues are driven by the business cycle at heart, although they may be affected by it. Secular forces may show up in private markets earlier than public markets, because private market participants are closer to the technology and venture companies are quicker to adopt/build on new technologies.
Capital availability is the product of the two, shown in Figure 13 below. The highest capital availability comes when the peaks of both cycles coincide; this happened with e-commerce in the late 90s and crypto in the late 2010s, for instance.
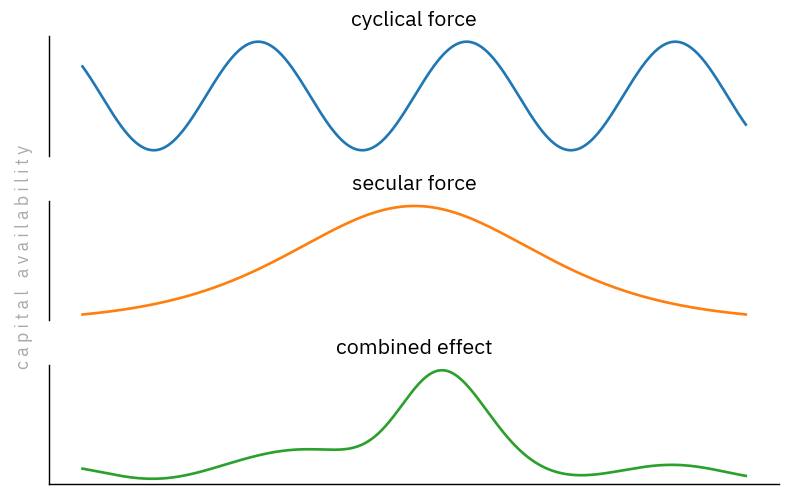
Figure: Combined secular and cyclical forces.
Source: Crunchbase and Tribe Capital analysis. For illustrative purposes only.
How is the Tech Adoption Gauge constructed?
The gauge is based on the proportion of VC dollars invested in a given category, something we term “prominence.” We refer to it as prominence for two reasons:
- It removes cyclical effects, which cause absolute VC dollars to go up or down.
- Some industries are naturally smaller than others, and shouldn’t be punished for this when deducing secular trends.
The gauge, in short, measures recent prominence against historical prominence. If recent prominence is higher than historical prominence, this indicates that the sector is growing.
Methodology
We use Crunchbase data to construct the Tech Adoption Gauge. It is constructed in a few steps:
- Define categories. Crunchbase uses fairly fine-grained industry tags. Companies typically have multiple tags, and we define a roughly MECE set–mutually exclusive (ME) and collectively exhaustive (CE)–by defining each category to include certain tags and exclude others. For instance, the Fintech category includes companies with such tags as Banking, Insurance, and Mobile Payments, while excluding companies that also have crypto tags such as Bitcoin or Cryptocurrency.
- Measure aggregate VC activity. We use total VC dollars invested. This is better than number of rounds, number of investors, etc., since dry powder is a limited and meaningful resource. We separate this metric by industry/geo, as well as by early/late stage. Early-stage means Seed-Series C; late-stage means most equity rounds thereafter. We make several corrections to the raw numbers. First, it takes some time for funding rounds to be logged after they are announced; we correct for this by looking at the reporting profile from the previous year. Second, we drop very large outliers.
- Calculate prominence. We calculate prominence for a geometric sequence of windows: last seven weeks, one year, and seven years. We calculate two ratios of prominence: (seven weeks)/(one year), and (one year)/(seven years).
- Combine and normalize. We take the log of these ratios and take a weighted average. We then apply a soft cap function to help the interpretability of extreme events. This gives us a value in (-2, 2) that comprises the secular forces gauge.
Figure: Illustration of how the Tech Adoption Gauge is constructed. We compare prominence among the last 7 weeks (blue) against prominence of the last year (orange), and prominence of the last year against prominence over the last 7 years (green). The results are combined in a weighted average, favoring the latter (longer-term) ratio.
Source: Crunchbase and Tribe Capital internal analysis.
How are other industries faring?
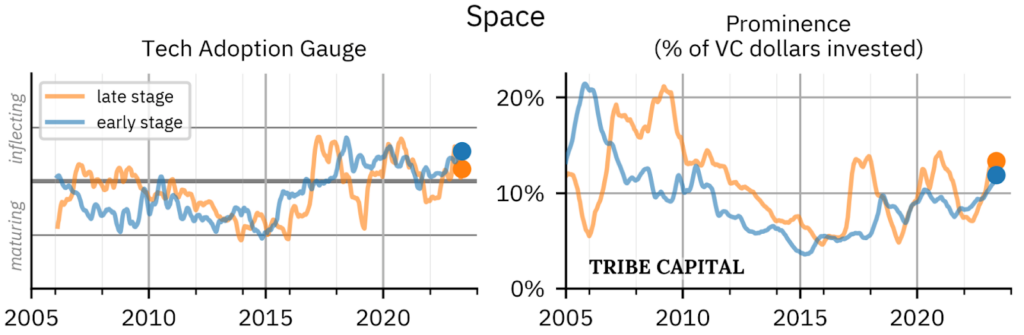
Figure: Gauge and prominence for space, showing and industry that is heating up for the second time.
Source: Crunchbase and Tribe Capital Analysis.
The third most prominent sector is space, which is driven by the secular force of great power competition. Examples abound of increased government spending on aerospace: the USSF requested a 15% increase to $30bn, the newly-minted Saudi Space Commission commands a multi-billion-dollar budget, and China is funding its own space station. Much of this money is falling into the hands of space startups, which can outmaneuver or outsource from legacy contractors. VC markets have taken the cue: even in late 2022, when VC funding in most sectors had begun to free-fall, annualized VC funding for space was still over ¾ of its all-time high. The number of Series A rounds reached a local maximum in February 2023, while Series B and C rounds ticked up as well.
Given the highly geopolitical nature of space, there are strict national boundaries on where investors can participate (both formal and informal). Speaking for the US, we’ve identified three kinds of space investors that are pouring money into the sector. Specialized funds, such as Airbus Ventures and Seraphim Space, commit most of their money to the sector. On the other hand, a growing number of “toe-dipping” funds have deployed experimental investments into smaller rounds. A class of high-conviction larger funds, including entities such as Tribe Capital, a16z, and General Catalyst, have deployed meaningful capital into the space.
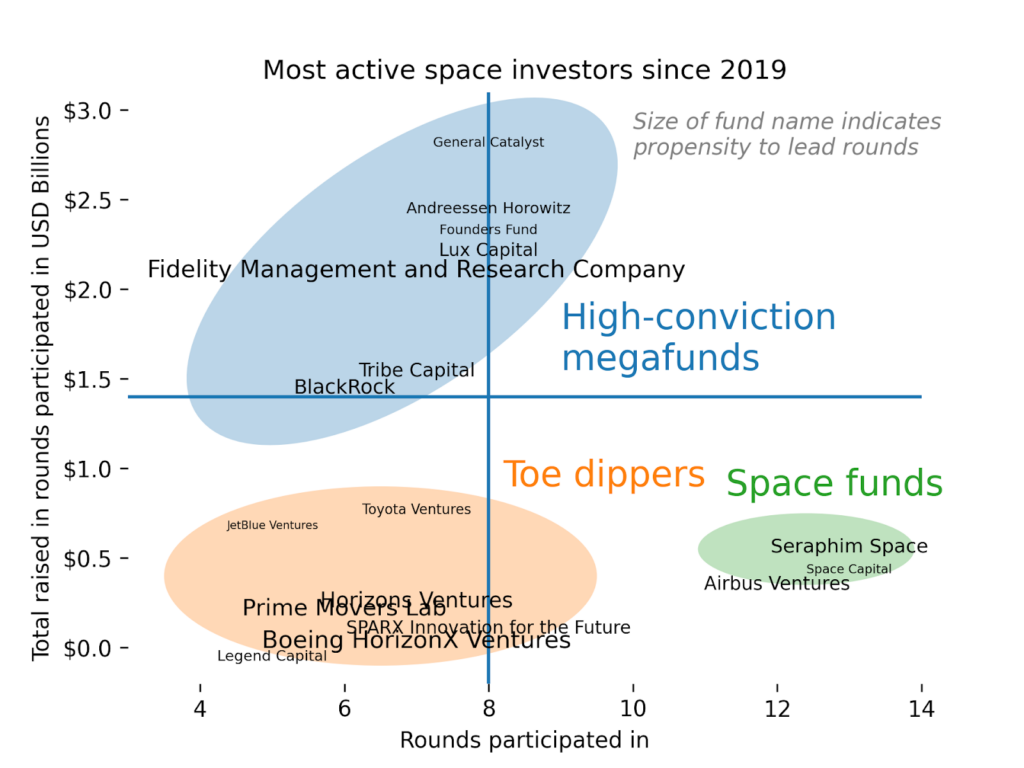
Figure: New Space investors by # rounds participated aggregate value
of these rounds (from all investors in these rounds)
Source: Crunchbase and Tribe Capital Analysis.
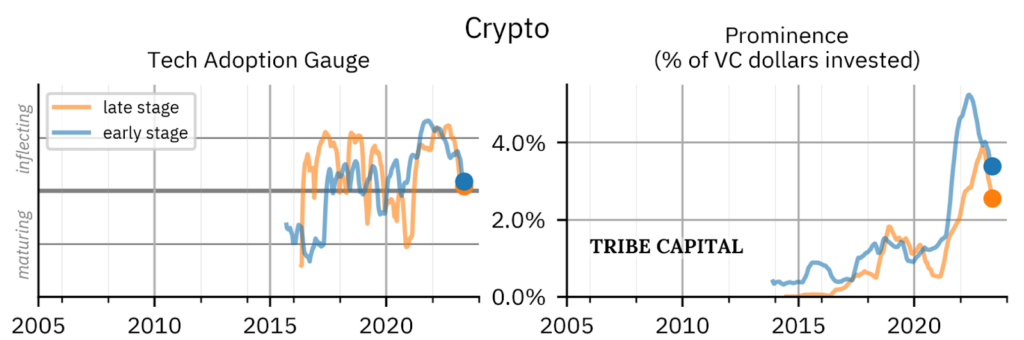
Figure: Crypto Tech Adoption Gauge shows that the industry is cooling down, but not in “mature” territory.
Source: Crunchbase and Tribe Capital internal analysis.
Some might be surprised to see crypto on the list of sectors with positive tailwinds. As recently as April 2023, crypto prominence is still ⅔ of its all-time high in early 2022. The gauge captures two realities about crypto markets. First, investment in crypto has quickly dived in popularity in the last 15 months. Conversely, prominence is still much higher than it was for almost all of crypto history. The rate of capital deployment, corrected for cyclical forces, is at late-2021 levels, and more than 2x what it was throughout 2020. For that, we believe it deserves to be called “growing.” However, if prominence continues to dip, the gauge will quickly move into cooler territory.
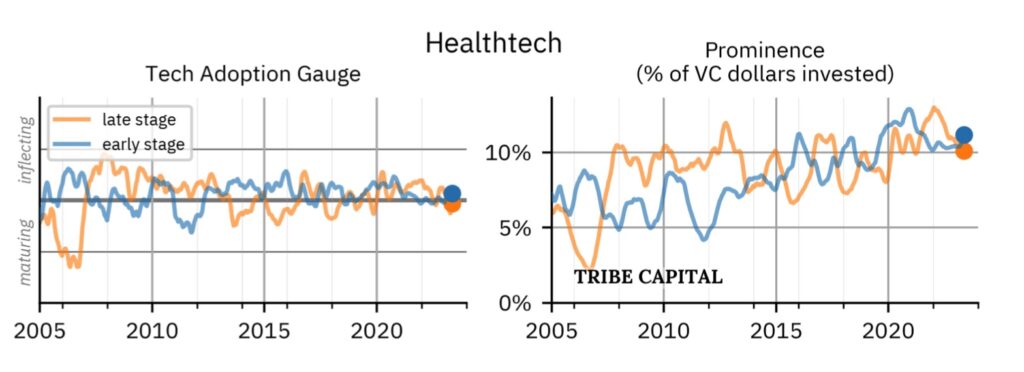
Figure: Healthtech has been consistently warm as healthtech prominence slowly increased to over 10% of VC funding.
Source: Crunchbase and Tribe Capital internal analysis.
Healthcare is an industry that has maintained a high level of sustaining innovation, and which has not really seen disruptive innovation for at least 20 years. Electronic health records are much older than this gauge covers; medical devices are largely uncovered in this analysis, and life sciences/biotech are treated separately. As a result, healthtech has remained a fairly steady ~10% of VC investment. A rise in investment through the second half of the ‘10s shows up in the gauge, pushing the industry into demand. Moving forward, we believe that healthtech will be driven much more by social movements, such as outcomes-based payment and wellness tech. These trends have teeth in the form of public spending, so we believe that healthtech deserves a high space on the secular forces list.
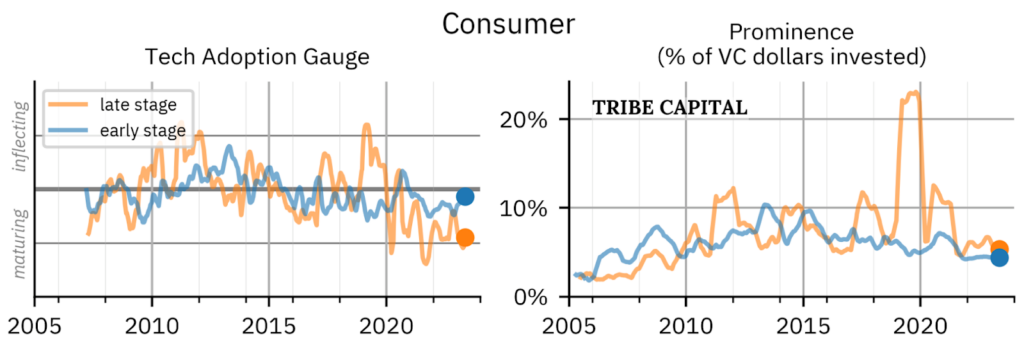
Figure: Consumer Inflection Gauge shows a maturing industry.
Source: Crunchbase and Tribe Capital internal analysis.
Consumer, by which we mostly mean D2C, appears to be cooling/maturing at the macro level. The core ecommerce tech behind this segment, as we’ve seen, is maturing. The secular force of covid briefly provided a bump in early-stage funding that quickly died out. Being in “cool” territory doesn’t mean the industry is dead; it simply means that the industry is expected to be slower-growing relative to other spaces, and that lower investment can be expected as a result. At the moment, we’re on the lookout for social movements that may categorically push forward the industry.
Legal Notices
This document is strictly confidential and is intended for authorized recipients only. It includes confidential, proprietary, and trade secret information of Tribe Capital Management, LLC (“Tribe Capital”) and is presented for discussion purposes only. Any unauthorized copying, disclosure, or distribution of the material in this presentation is strictly forbidden without the express written consent of Tribe Capital.
This document is for information purposes only and is not intended as investment advice, an offer, or solicitation with respect to the purchase or sale of any security.
There is no guarantee that any investment objective will be achieved. Past performance is not indicative of future results, which may vary. Actual results may differ materially from those expressed or implied. Unless otherwise noted, the valuation of the specific investment opportunity contained within this presentation is based upon information and data available as of the date these materials were prepared.
An investment with Tribe Capital is speculative and involves significant risks, including the potential loss of all or a substantial portion of invested capital, the potential use of leverage, and the lack of liquidity of an investment. Recipients should not assume that securities or any companies identified in this presentation, or otherwise related to the information in this presentation, are, have been or will be, investments held by accounts managed by Tribe Capital or that investments in any such securities have been or will be profitable. Please refer to the Private Placement Memorandum or Statement of Investment Considerations, as applicable, and Tribe’s Form ADV, available at www.advisorinfo.sec.gov, for important information about an investment with Tribe Capital.
Any companies identified herein in which Tribe is invested do not represent all of the investments made or recommended for any account managed by Tribe Capital. Please contact Tribe Capital for information related to investments made by Tribe Capital in the past 12 months.
Certain information presented herein has been supplied by third parties, including management or agents of the underlying portfolio company. While Tribe believes such information to be accurate, it has relied upon such third parties to provide accurate information and has not independently verified such information.
This document contains forward-looking statements. The opinions, forecasts, projections, or other statements, other than statements of historical fact, are forward-looking statements. Forward-looking statements can be identified by the use of words such as “anticipate,” “intend,” “believe,” “estimate,” “plan,” “seek,” “project,” “expect,” “may,” “will,” “would,” “could” or “should,” the negative of these terms or other comparable terminology. Examples of forward-looking statements include statements relating to macroeconomic conditions, expectations regarding future growth, including future revenue and earnings increases, margins, free cash flow projections, and annual growth rates; growth plans and opportunities, including our strategies for future or potential acquisitions, product expansion, targets, and geographic expansion; estimated returns, now or in the future; and assumptions underlying these expectations. Actual events or results or the actual performance may differ materially from those reflected or contemplated in such statements. Prospective investors should pay close attention to the assumptions underlying the analyses and forecasts contained in this presentation, which are based on assumptions believed to be reasonable in light of the information presently available. Such assumptions may require modification as additional information becomes available. Nothing contained in this presentation may be relied upon as a guarantee, promise, assurance, or a representation as to the future. These statements have not been reviewed by anyone outside of Tribe Capital and while Tribe Capital believes these statements are reasonable, they do involve a number of assumptions, risks, and uncertainties.
The graphs, charts, and other visual aids are provided for informational purposes only. None of these graphs, charts, or visual aids can of themselves be used to make investment decisions. No representation is made that these will assist any person in making investment decisions and no graph, chart or other visual aid can capture all factors and variables required in making such decisions.
TRIBE CAPITAL®, N-of-1™, and certain other marks or logos displayed on this presentation are trademarks owned by Tribe Capital. You may not use any of those or any other Tribe Capital trademarks or trade names in any manner that creates the impression that such names and marks belong to or are associated with you or your affiliates or are used with Tribe Capital’s consent.